| Anguilla |
|
|
|
|
|
|
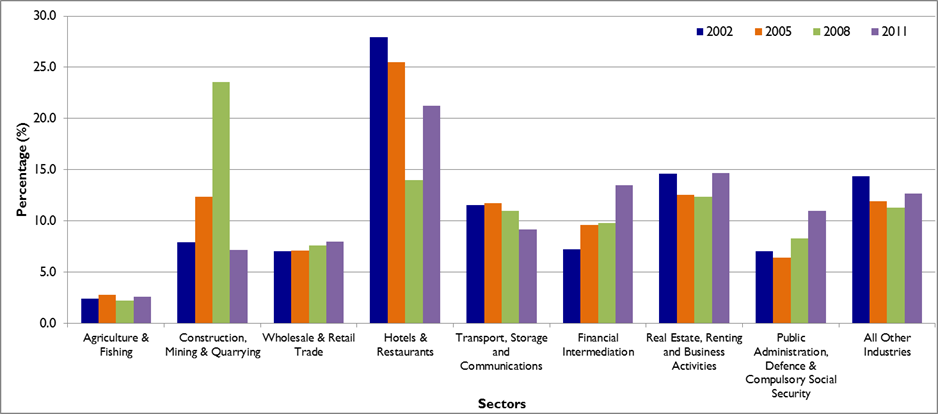
| Chart 1 |
|
| Percentage
Contribution of GVA by Economic Activity in Current Prices |
|
|
|
|
|
|
|
|
|
|
|
|
|
|
|
|
|
|
|
|
|
|
|
|
|
|
|
|
|
|
|
|
|
|
|
|
|
|
|
|
|
|
|
|
|
|
|
|
|
|
|
|
|
|
|
| INDUSTRY |
2001 |
2002 |
2003 |
2004 |
2005 |
2006 |
2007 |
2008 |
2009 |
2010 |
2011 |
|
|
|
|
|
|
| Agriculture & Fishing |
2.18 |
2.43 |
2.32 |
2.41 |
2.75 |
2.35 |
1.97 |
2.20 |
2.15 |
2.11 |
2.61 |
|
|
|
|
|
|
| Construction, Mining & Quarrying |
10.02 |
7.90 |
8.44 |
10.71 |
12.38 |
15.25 |
20.31 |
23.58 |
12.46 |
8.68 |
7.18 |
|
|
|
|
|
|
| Wholesale & Retail Trade |
7.62 |
7.04 |
6.34 |
6.44 |
7.12 |
8.07 |
7.62 |
7.58 |
8.93 |
8.18 |
8.00 |
|
|
|
|
|
|
| Hotels & Restaurants |
27.26 |
27.91 |
29.98 |
29.14 |
25.53 |
22.81 |
22.87 |
13.96 |
14.55 |
18.53 |
21.25 |
|
|
|
|
|
|
| Transport, Storage and Communications |
11.24 |
11.54 |
10.40 |
10.02 |
11.71 |
10.79 |
10.40 |
10.95 |
11.52 |
9.32 |
9.15 |
|
|
|
|
|
|
| Financial Intermediation |
8.29 |
7.21 |
8.18 |
10.43 |
9.62 |
8.90 |
8.24 |
9.80 |
9.85 |
12.55 |
13.48 |
|
|
|
|
|
|
| Real Estate, Renting and Business Activities |
14.24 |
14.58 |
14.27 |
12.78 |
12.55 |
12.64 |
11.51 |
12.34 |
13.71 |
14.77 |
14.68 |
|
|
|
|
|
|
| Public Administration, Defence & Compulsory Social Security |
6.59 |
7.06 |
7.00 |
6.83 |
6.41 |
6.90 |
6.84 |
8.29 |
11.69 |
12.40 |
10.99 |
|
|
|
|
|
|
| All Other Industries |
12.56 |
14.34 |
13.06 |
11.22 |
11.93 |
12.29 |
10.25 |
11.30 |
15.14 |
13.47 |
12.66 |
|
|
|
|
|
|
|
|
|
|
|
|
|
|
|
|
|
|
|
|
|
|
|
|
|
|
|
|
|
|
|
|
|
|
|
|
|
|
|
|
|
|
|
|
|
|
|
|
|
|
|
|
|
|
|
|
|
|
|
|
|
|
|
|
|
|
|
|
|
|
|
|
|
|
|
|
|
|
|
|
|
|
|
|
|
|
|
|
|
|
|
|
|
|
|
|
|
|
|
|
|
|
|
|
|
|
|
|
|
|
|
|
|
|
|
|
|
|
|
|
|
|
|
|
|
|
|
|
|
|
|
|
|
|
|
|
|
|
|
|
|
|
|
|
|
|
|
|
|
|
|
|
|
|
|
|
|
|
|
|
|
|
|
|
|
|
|
|
|
|
|
|
|
|
|
|
|
|
|
|
|
|
|
|
|
|
|
|
|
|
|
|
|
|
|
|
|
|
|
|
|
|
|
|
|
|
|
|
|
|
|
|
|
|
|
|
|
|
|
|
|
|
|
|
|
|
|
|
|
|
|
|
|
|
|
|
|
|
|
|
|
|
|
|
|
|
|
|
|
|
|
| Source: Anguilla Statistics
Department /ECCB |
|
|
|
|
|
|
|
|
|
|
|
|
|
|
|
|
|
|
|