| Anguilla |
|
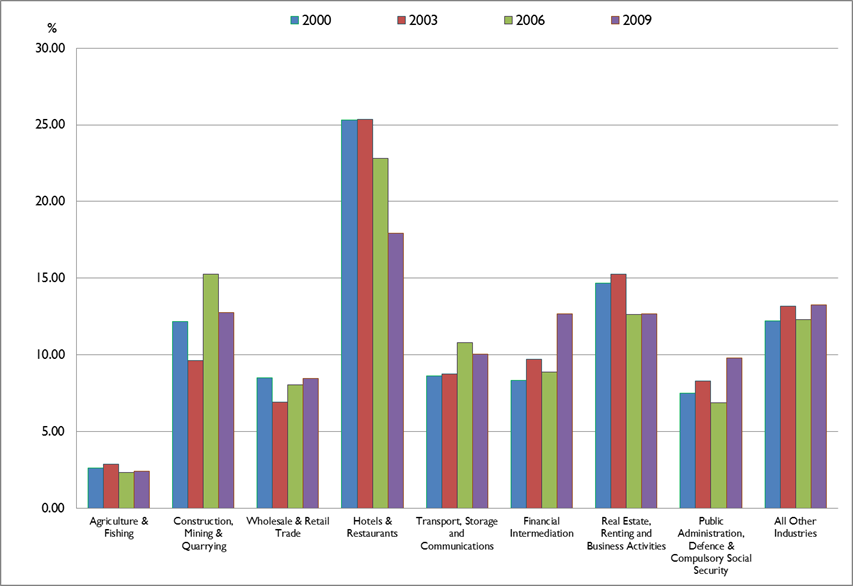
| Chart 2 |
|
| Percentage
Contribution of GVA by Economic Activity in Constant 2006 Prices |
|
|
|
|
|
|
|
|
|
|
|
|
|
|
|
|
|
|
|
|
|
|
|
|
|
|
|
|
|
|
|
|
|
|
|
|
|
|
|
|
|
|
|
|
|
|
| INDUSTRY |
2000 |
2001 |
2002 |
2003 |
2004 |
2005 |
2006 |
2007 |
2008 |
2009 |
|
|
|
|
| Agriculture & Fishing |
2.65 |
2.50 |
2.86 |
2.88 |
2.85 |
2.65 |
2.35 |
2.12 |
2.27 |
2.41 |
|
|
|
|
| Construction, Mining & Quarrying |
12.16 |
10.58 |
8.78 |
9.63 |
12.47 |
14.35 |
15.25 |
20.67 |
21.91 |
12.78 |
|
|
|
|
| Wholesale & Retail Trade |
8.49 |
8.03 |
7.79 |
6.93 |
7.04 |
7.50 |
8.07 |
8.00 |
7.45 |
8.45 |
|
|
|
|
| Hotels & Restaurants |
25.30 |
26.97 |
25.18 |
25.35 |
24.18 |
23.93 |
22.81 |
19.66 |
16.50 |
17.92 |
|
|
|
|
| Transport, Storage and Communications |
8.61 |
8.01 |
8.02 |
8.74 |
9.05 |
9.26 |
10.79 |
10.80 |
10.68 |
10.03 |
|
|
|
|
| Financial Intermediation |
8.35 |
9.52 |
9.58 |
9.73 |
10.09 |
9.10 |
8.90 |
8.57 |
10.07 |
12.67 |
|
|
|
|
| Real Estate, Renting and Business Activities |
14.70 |
14.63 |
15.75 |
15.26 |
14.09 |
13.36 |
12.64 |
12.11 |
12.07 |
12.66 |
|
|
|
|
| Public Administration, Defence & Compulsory Social Security |
7.50 |
7.45 |
8.19 |
8.30 |
7.90 |
7.31 |
6.90 |
6.25 |
7.05 |
9.81 |
|
|
|
|
| All Other Industries |
12.24 |
12.31 |
13.85 |
13.18 |
12.34 |
12.54 |
12.29 |
11.83 |
12.00 |
13.28 |
|
|
|
|
|
|
|
|
|
|
|
|
|
|
|
|
|
|
|
|
|
|
|
|
|
|
|
|
|
|
|
|
|
|
|
|
|
|
|
|
|
|
|
|
|
|
|
|
|
|
|
|
|
|
|
|
|
|
|
|
|
|
|
|
|
|
|
|
|
|
|
|
|
|
|
|
|
|
|
|
|
|
|
|
|
|
|
|
|
|
|
|
|
|
|
|
|
|
|
|
|
|
|
|
|
|
|
|
|
|
|
|
|
|
|
|
|
|
|
|
|
|
|
|
|